1. Prepare representative data
Review image quality and labels. Use annotated examples for known objects, and representative normal images for anomaly model fitting and calibration.
Abraia Vision
Fine-tune detection, segmentation, and anomaly models. Connect predictions to tracking, regions, and counters for real-time camera applications.

From data to deployment
Review image quality and labels. Use annotated examples for known objects, and representative normal images for anomaly model fitting and calibration.
Fine-tune detection and segmentation models or train anomaly models, then check results on held-out data.
Connect predictions to tracking, regions, and counters, then run the workflow locally at the camera.
01 · Prepare data
Review images, metadata, and annotation coverage in the Gallery. Check image quality and similar-image findings, then add image labels, boxes, or polygons for classification, detection, and segmentation tasks.
For anomaly detection, use representative normal images for fitting and calibration, and reserve defect examples for evaluation. Keeping curation and annotation together makes it easier to catch gaps before training.
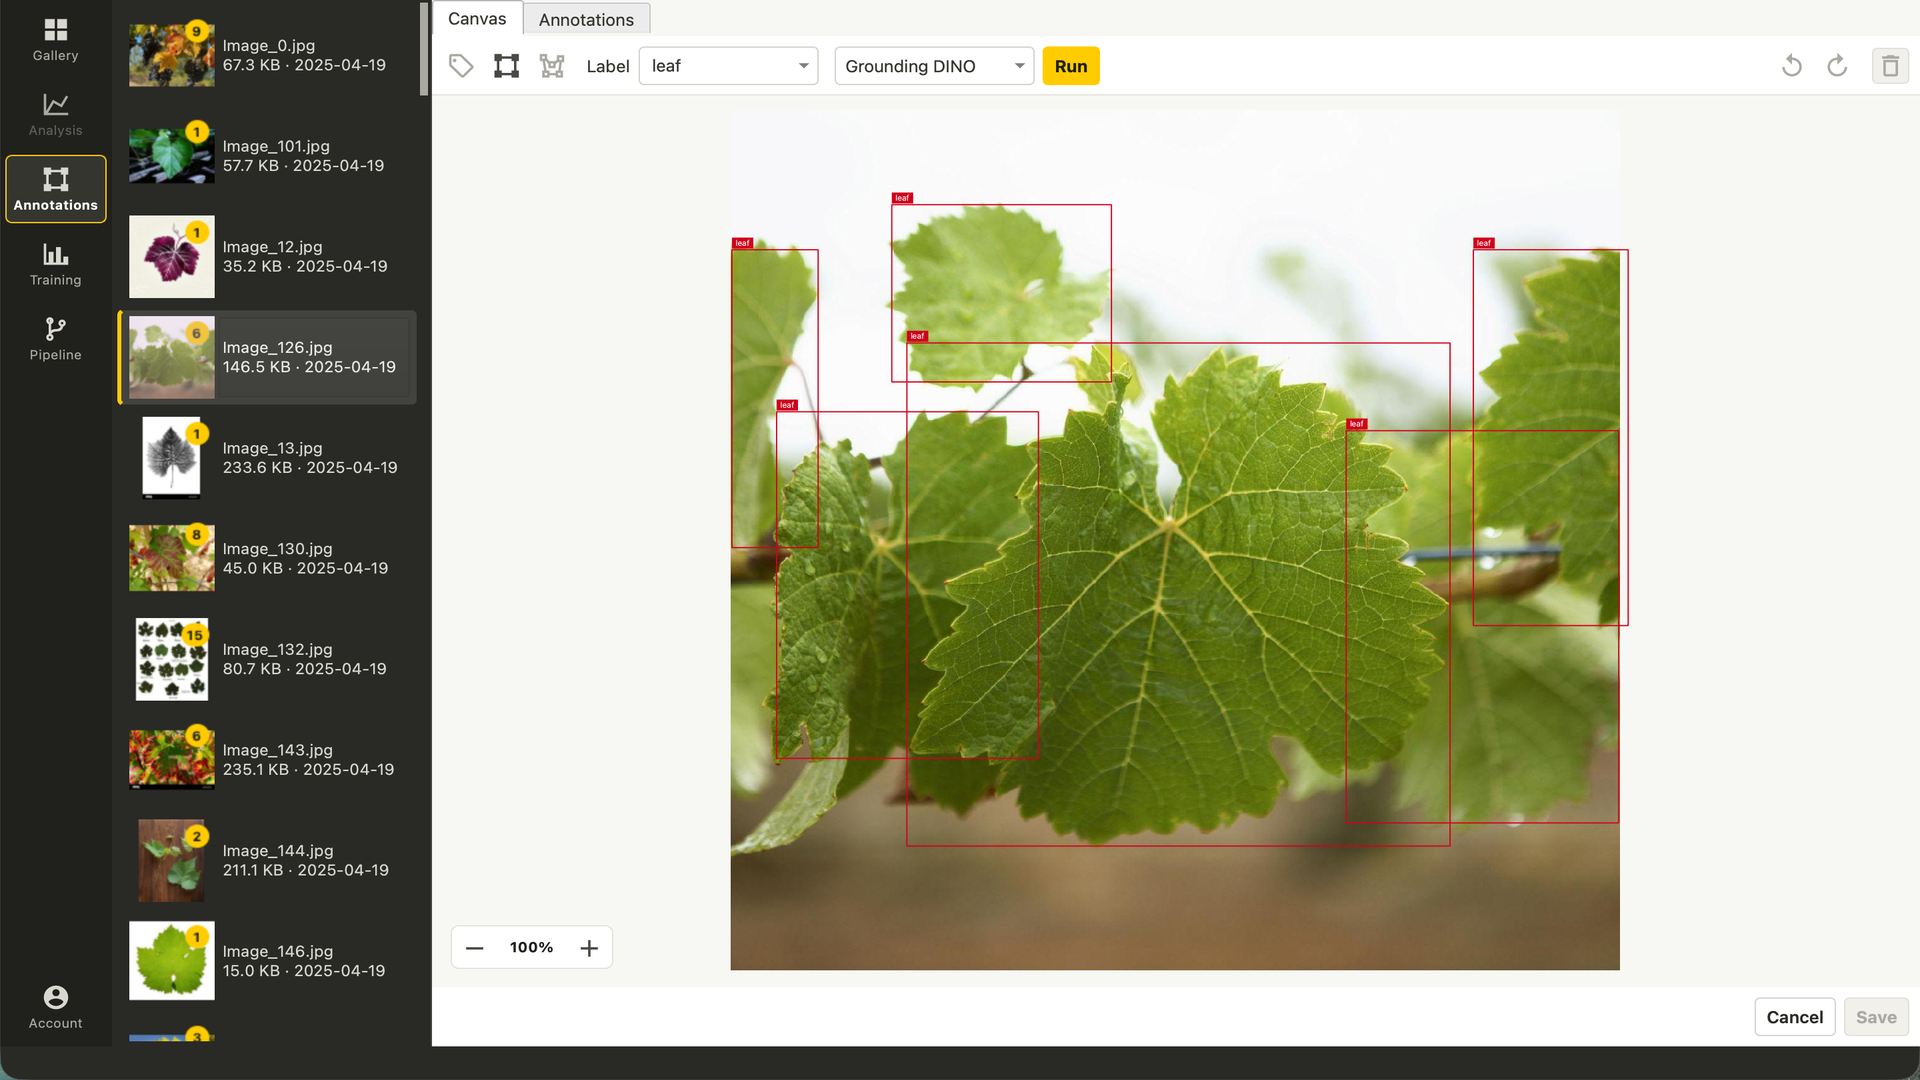
02 · Train and evaluate
Fine-tune classification, object detection, and instance segmentation models on supported annotated RGB datasets. For defects without exhaustive labels, train PatchCore, EfficientAD, Dinomaly, or SubspaceAD from normal images.
Review training splits, validation metrics, predicted anomaly labels, and calibrated heatmaps on held-out samples. Defect boxes or polygons enable pixel-level localization metrics. Compatible ONNX anomaly models can run in local camera pipelines. Explore industrial inspection.

03 · Build the application
Compose camera, stream, image, or video sources with model stages. Track detections, filter by regions, count line crossings, and measure time inside a region.
Prototype and inspect the workflow in Studio, then develop a custom local application with embedded vision tools.
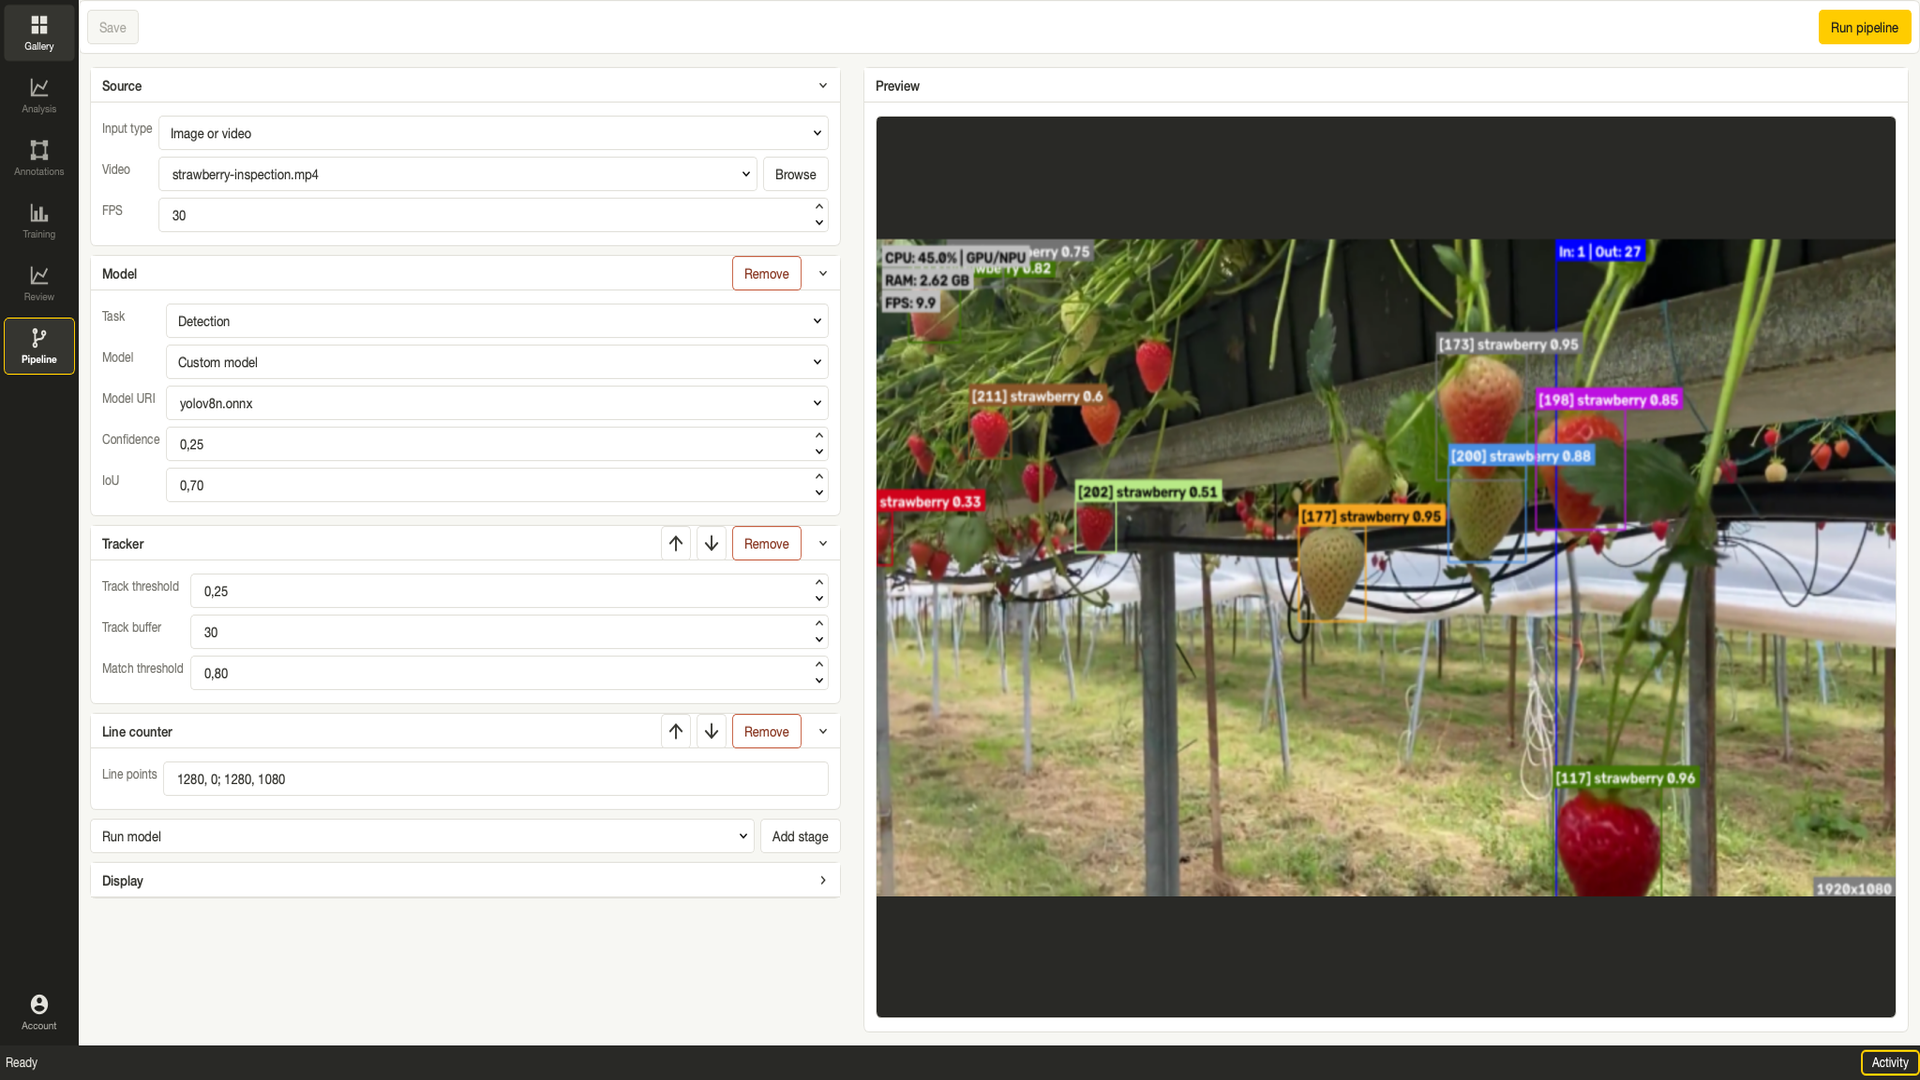
Applications
Explore example workflows by industry and data type.
Find unusual defects with anomaly detection or recognize known defect types.
Analyze crops and produce with RGB or multispectral imagery.
Track people, count line crossings, and measure time in a region.
Tell us about the data, operating environment, and decision you want the system to support. We can identify a practical first evaluation.